Embedded Files
How planets form around different mass stars? In this study, we try to figure out what process sets the final masses of the planets. We developed a pebble-driven core accretion model to study the formation and evolution of planets around stars in the stellar mass range of 0.08 M⊙-1 M⊙. By Monte Carlo sampling of the initial conditions, the growth and migration of a large number of individual protoplanetary embryos were simulated in a population synthesis manner. The forming planets are compared with the observed exoplanets, with respect to planetary mass, semimajor axis, metallicity, and water content.
We find that gas giant planets are likely to form when the gas disk sizes are larger, the disk accretion rates are higher, the disks are more metal-rich, and/or their stellar hosts are more massive. Our model shows that, first, the characteristic mass of super-Earth is set by the pebble isolation mass. This mass refers to that a planet starts to open a shallow gap and reverses the local pressure gradient. In this circumstance, pebble drift and stop at the local pressure maximum exterior to the planet orbit. Thus, the core mass growth by pebble accretion is halted. Super-Earth masses increase linearly with the masses of its stellar hosts, which corresponding to one Earth mass around a late M-dwarf star and 20 Earth masses around a solar-mass star. Second, the low-mass planets, up to 20 M⊕, can form around stars with a wide range of metallicities, while massive gas giant planets are preferred to grow around metal-rich stars. Altogether, our model succeeds in quantitatively reproducing several important observed properties of exoplanets and correlations with their stellar hosts. See details for Liu et al. 2019, A&A [ADS] [arxiv].
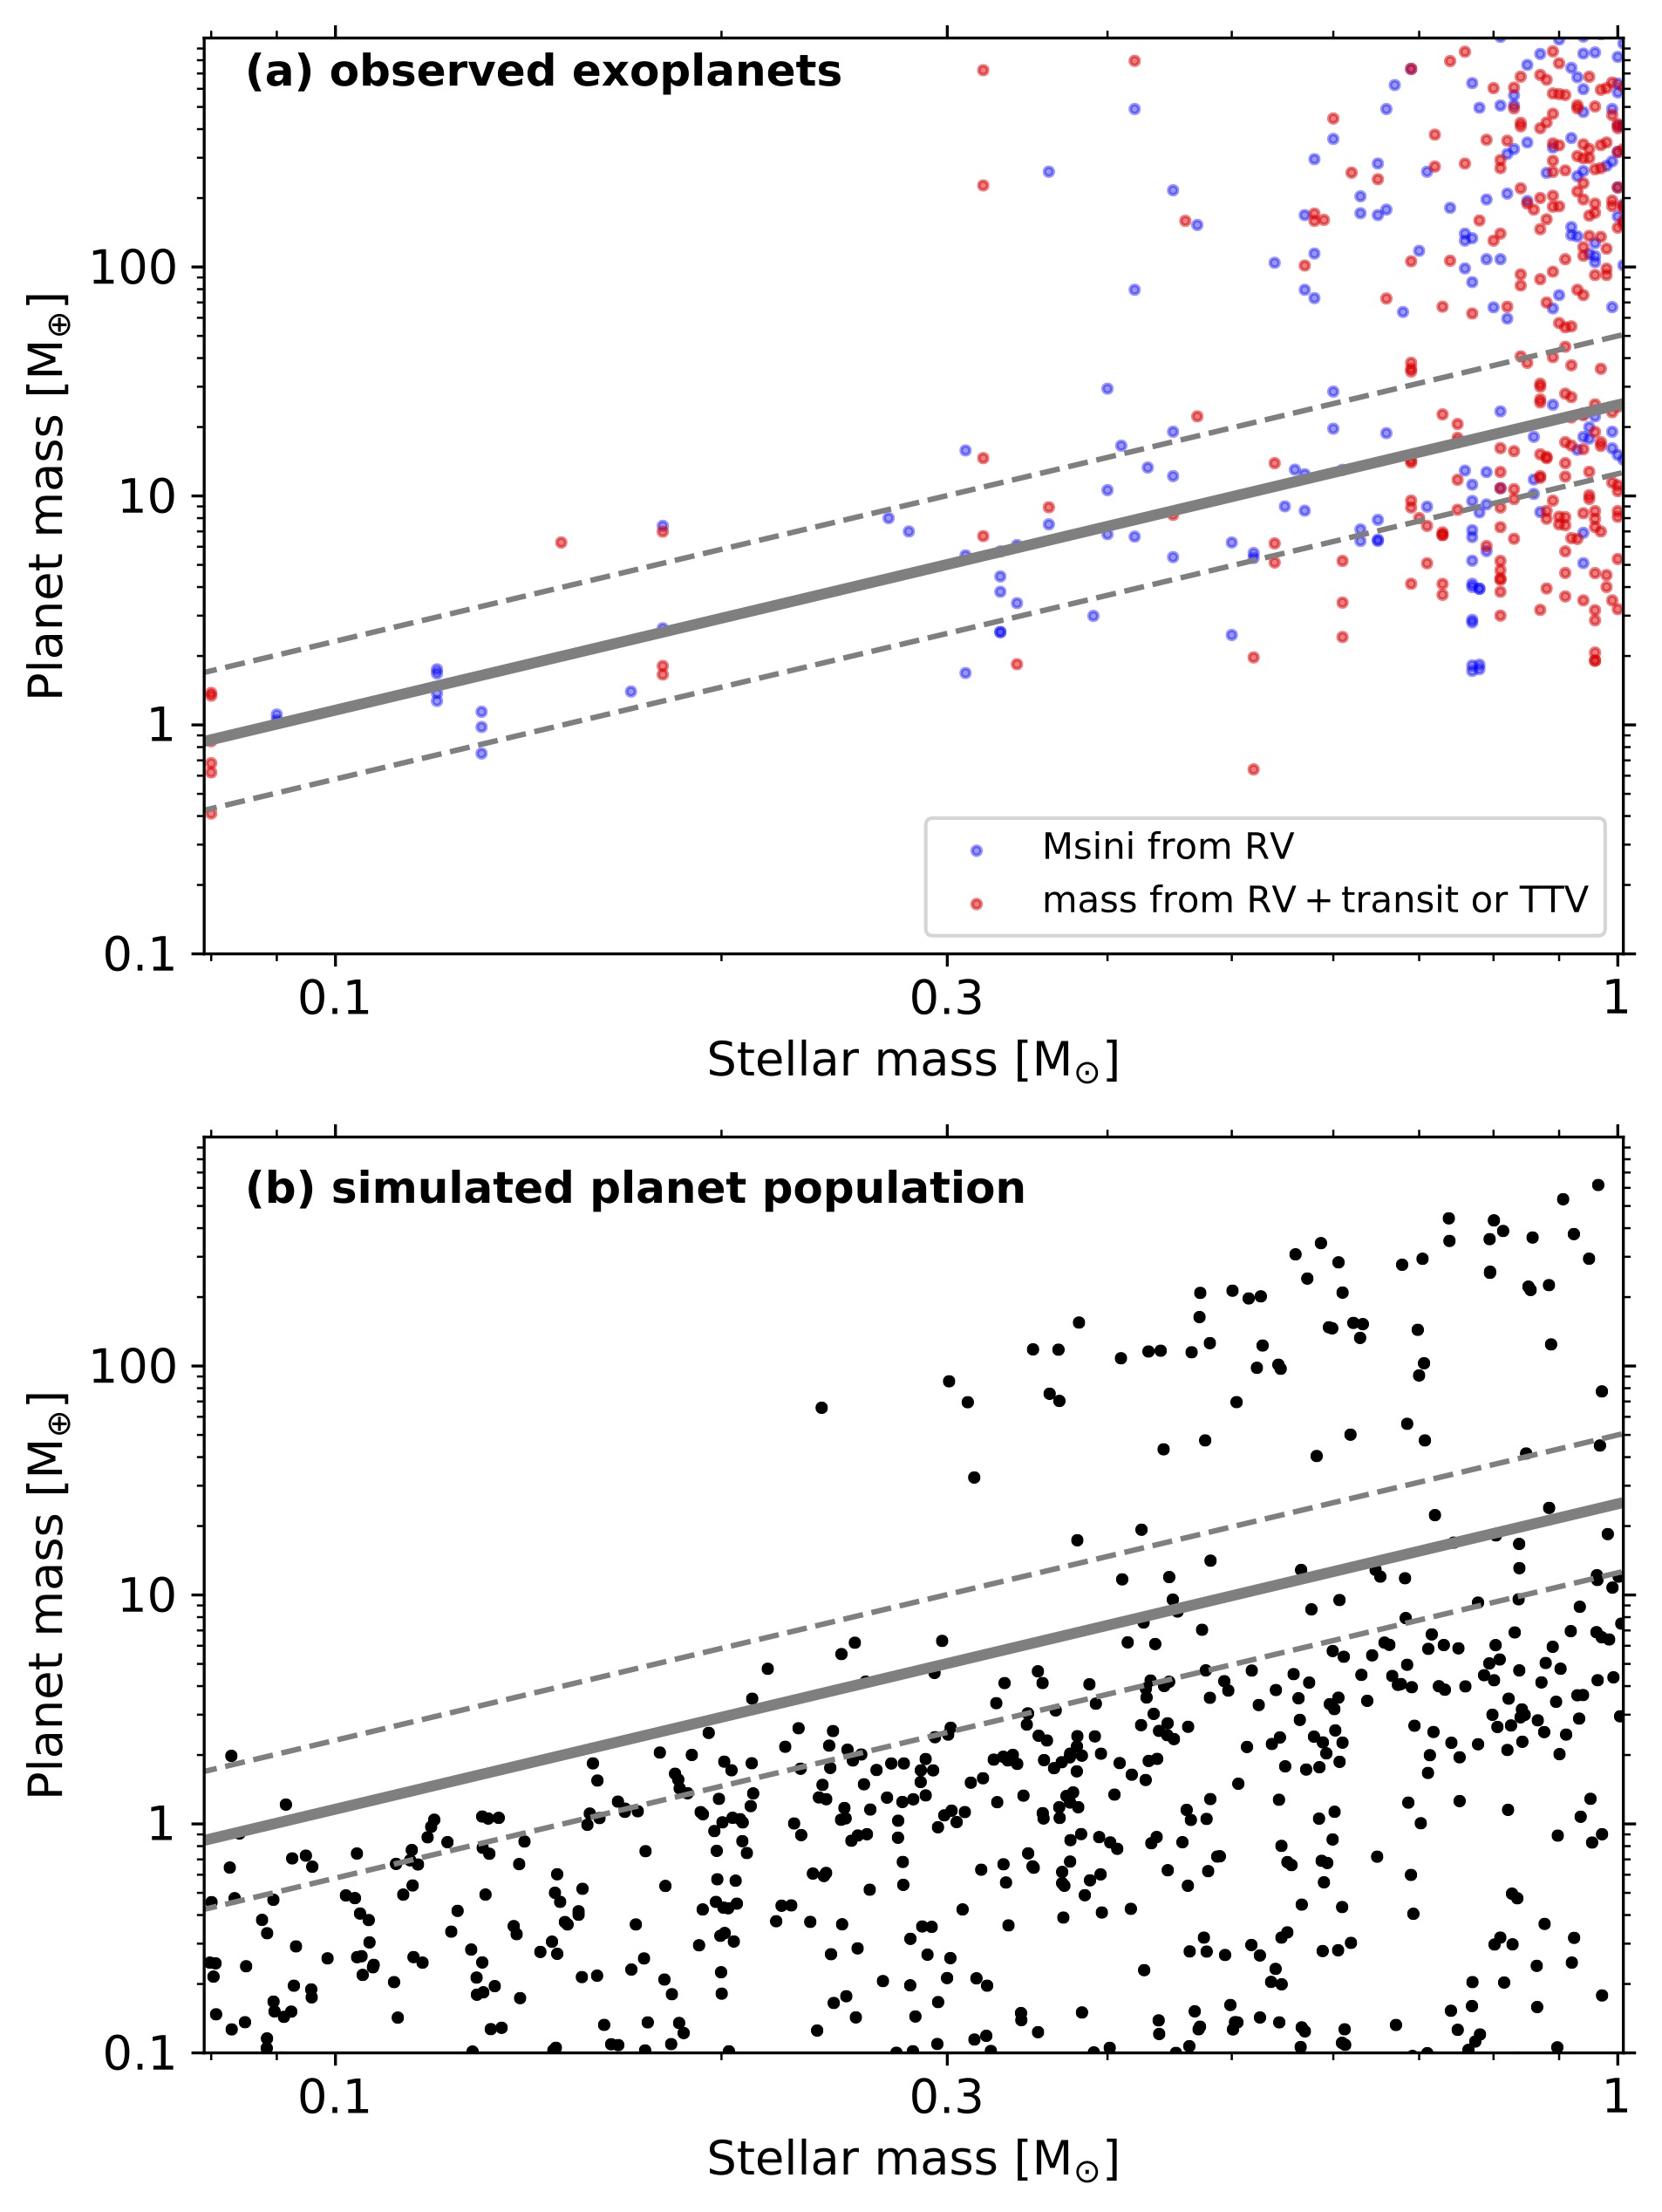
Fig.1: Planet mass vs stellar mass for exoplanet observations (upper) and simulated planet populations (lower). The characteristic mass of the super-Earths increases linearly with their stellar hosts.
Figure 1 shows the masses of the observed exoplanets (upper) and simulated planets (lower) vs the masses of their stellar hosts. The blue and red dots indicated the detected samples with known planet masses (TTV or a combination of radial velocity and transit methods) or the minimum masses (radial velocity only), whereas the black dots represent the simulated planets from single-planet systems. Note that observations are limited to close-in planets without taking into account microlensing planets. The black line marks the pebble isolation mass.
We find that the planets around low-mass M-dwarfs (<0.3 Msun) follow the linear mass scaling quite well. Gas giant planets are frequently detected around more massive, FGK stars. However, they are hardly found around very low-mass stars of <0.2Msun. The deficit of massive planets in the upper left panel is astrophysical. This is because the core of the planet is finally regulated by the pebble isolation process. The isolation mass is so low for planets around such tiny stars. Therefore, the giant planet formation is largely inhibited for stellar hosts with masses <0.2Msun.
Page updated
Google Sites
Report abuse